How to use?
Welcome!
In a moment you’ll be able to explore some impact landscapes. Before you dive in, it is advised to quickly go through this short tutorial on how to use them.
Impact landscapes are interactive Voronoi treemaps that aim to support the interpretation and communication of Life Cycle Assessment (LCA) results.
Every landscape represents the impact contribution tree of a single product system or one of its (sub)processes. As such, every field of the landscape marks a process within the contribution tree of its parent product system. Furthermore, every process can have subprocesses and, therefore, the landscape has several (hidden) layers. How you can navigate the landscape(s) and their layers will be presented in the subsequent tutorial steps.
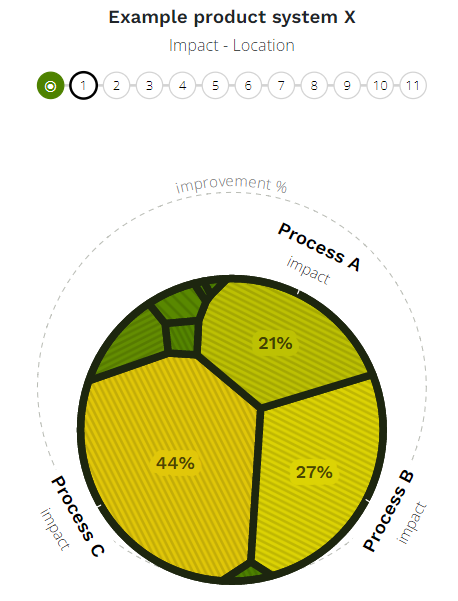
The amount of impact that is associated with every field is indicated both by its color and its surface area size. Like the type of impact (e.g. climate change), the color and size specification are data-dependent. Therefore, more detailed information on these 3 aspects can be found in the legend to the left of the landscapes.
When comparing multiple impacts landscapes to each other, a dashed ring will indicate the impact improvement of a landscape compared to the biggest/worst landscape. To help you identify impact “hotspots”, fields with a large impact have been annotated with their corresponding process name. When necessary, you can add and delete annotations yourself by right-clicking on the fields.
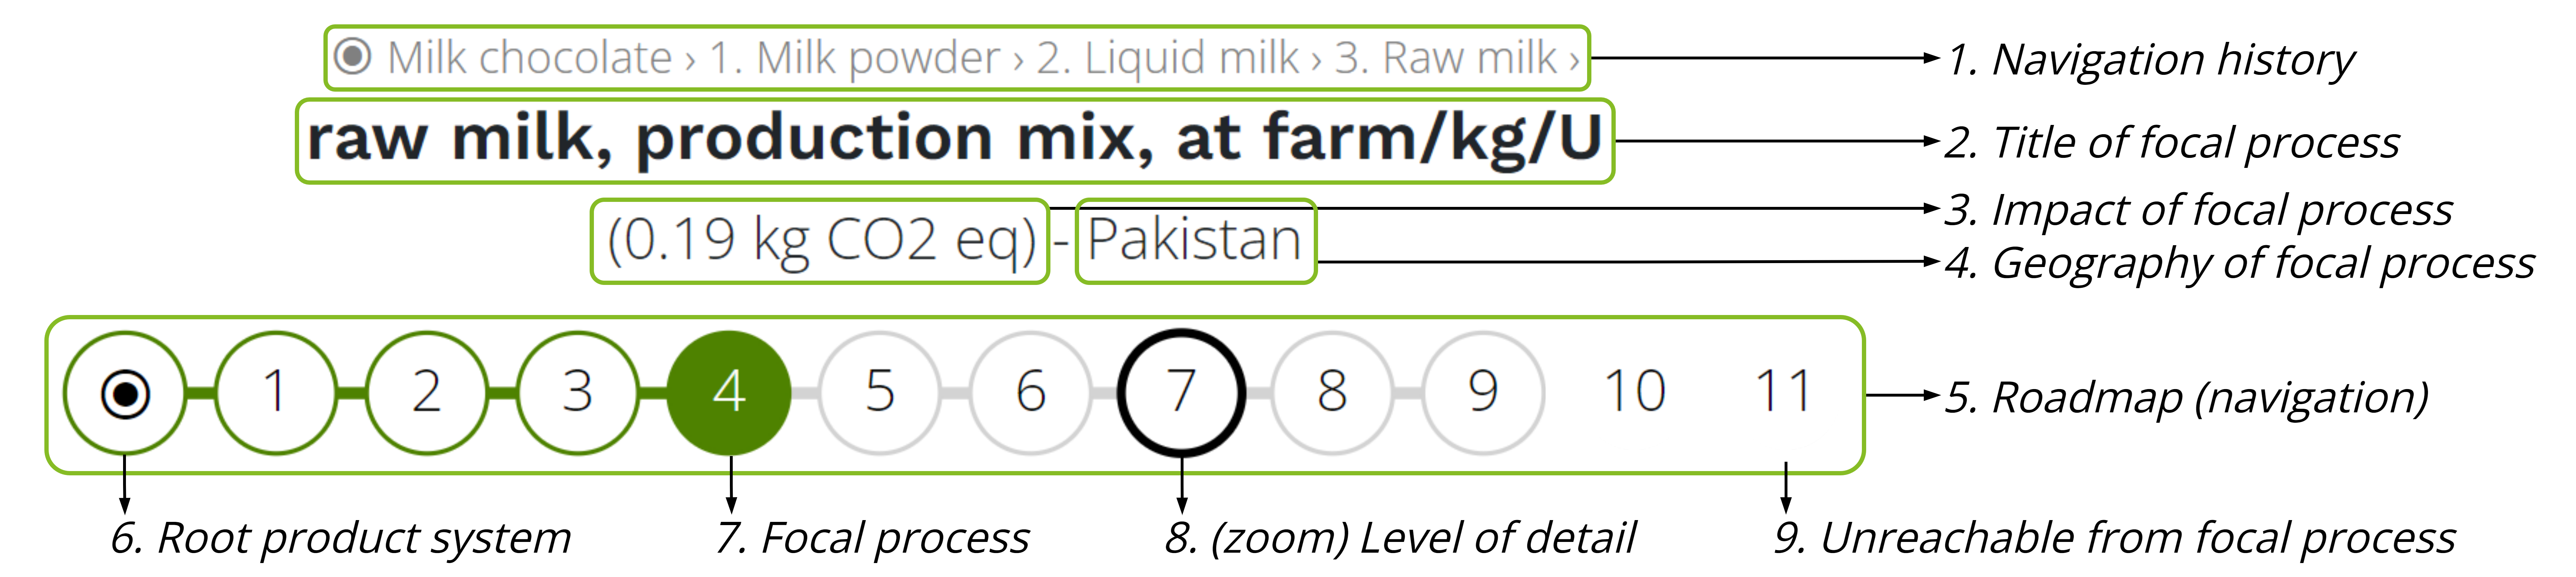
Above every landscape, there is an area that contains two key elements, namely, the information regarding the focal process and the navigation of the landscape.
The Roadmap
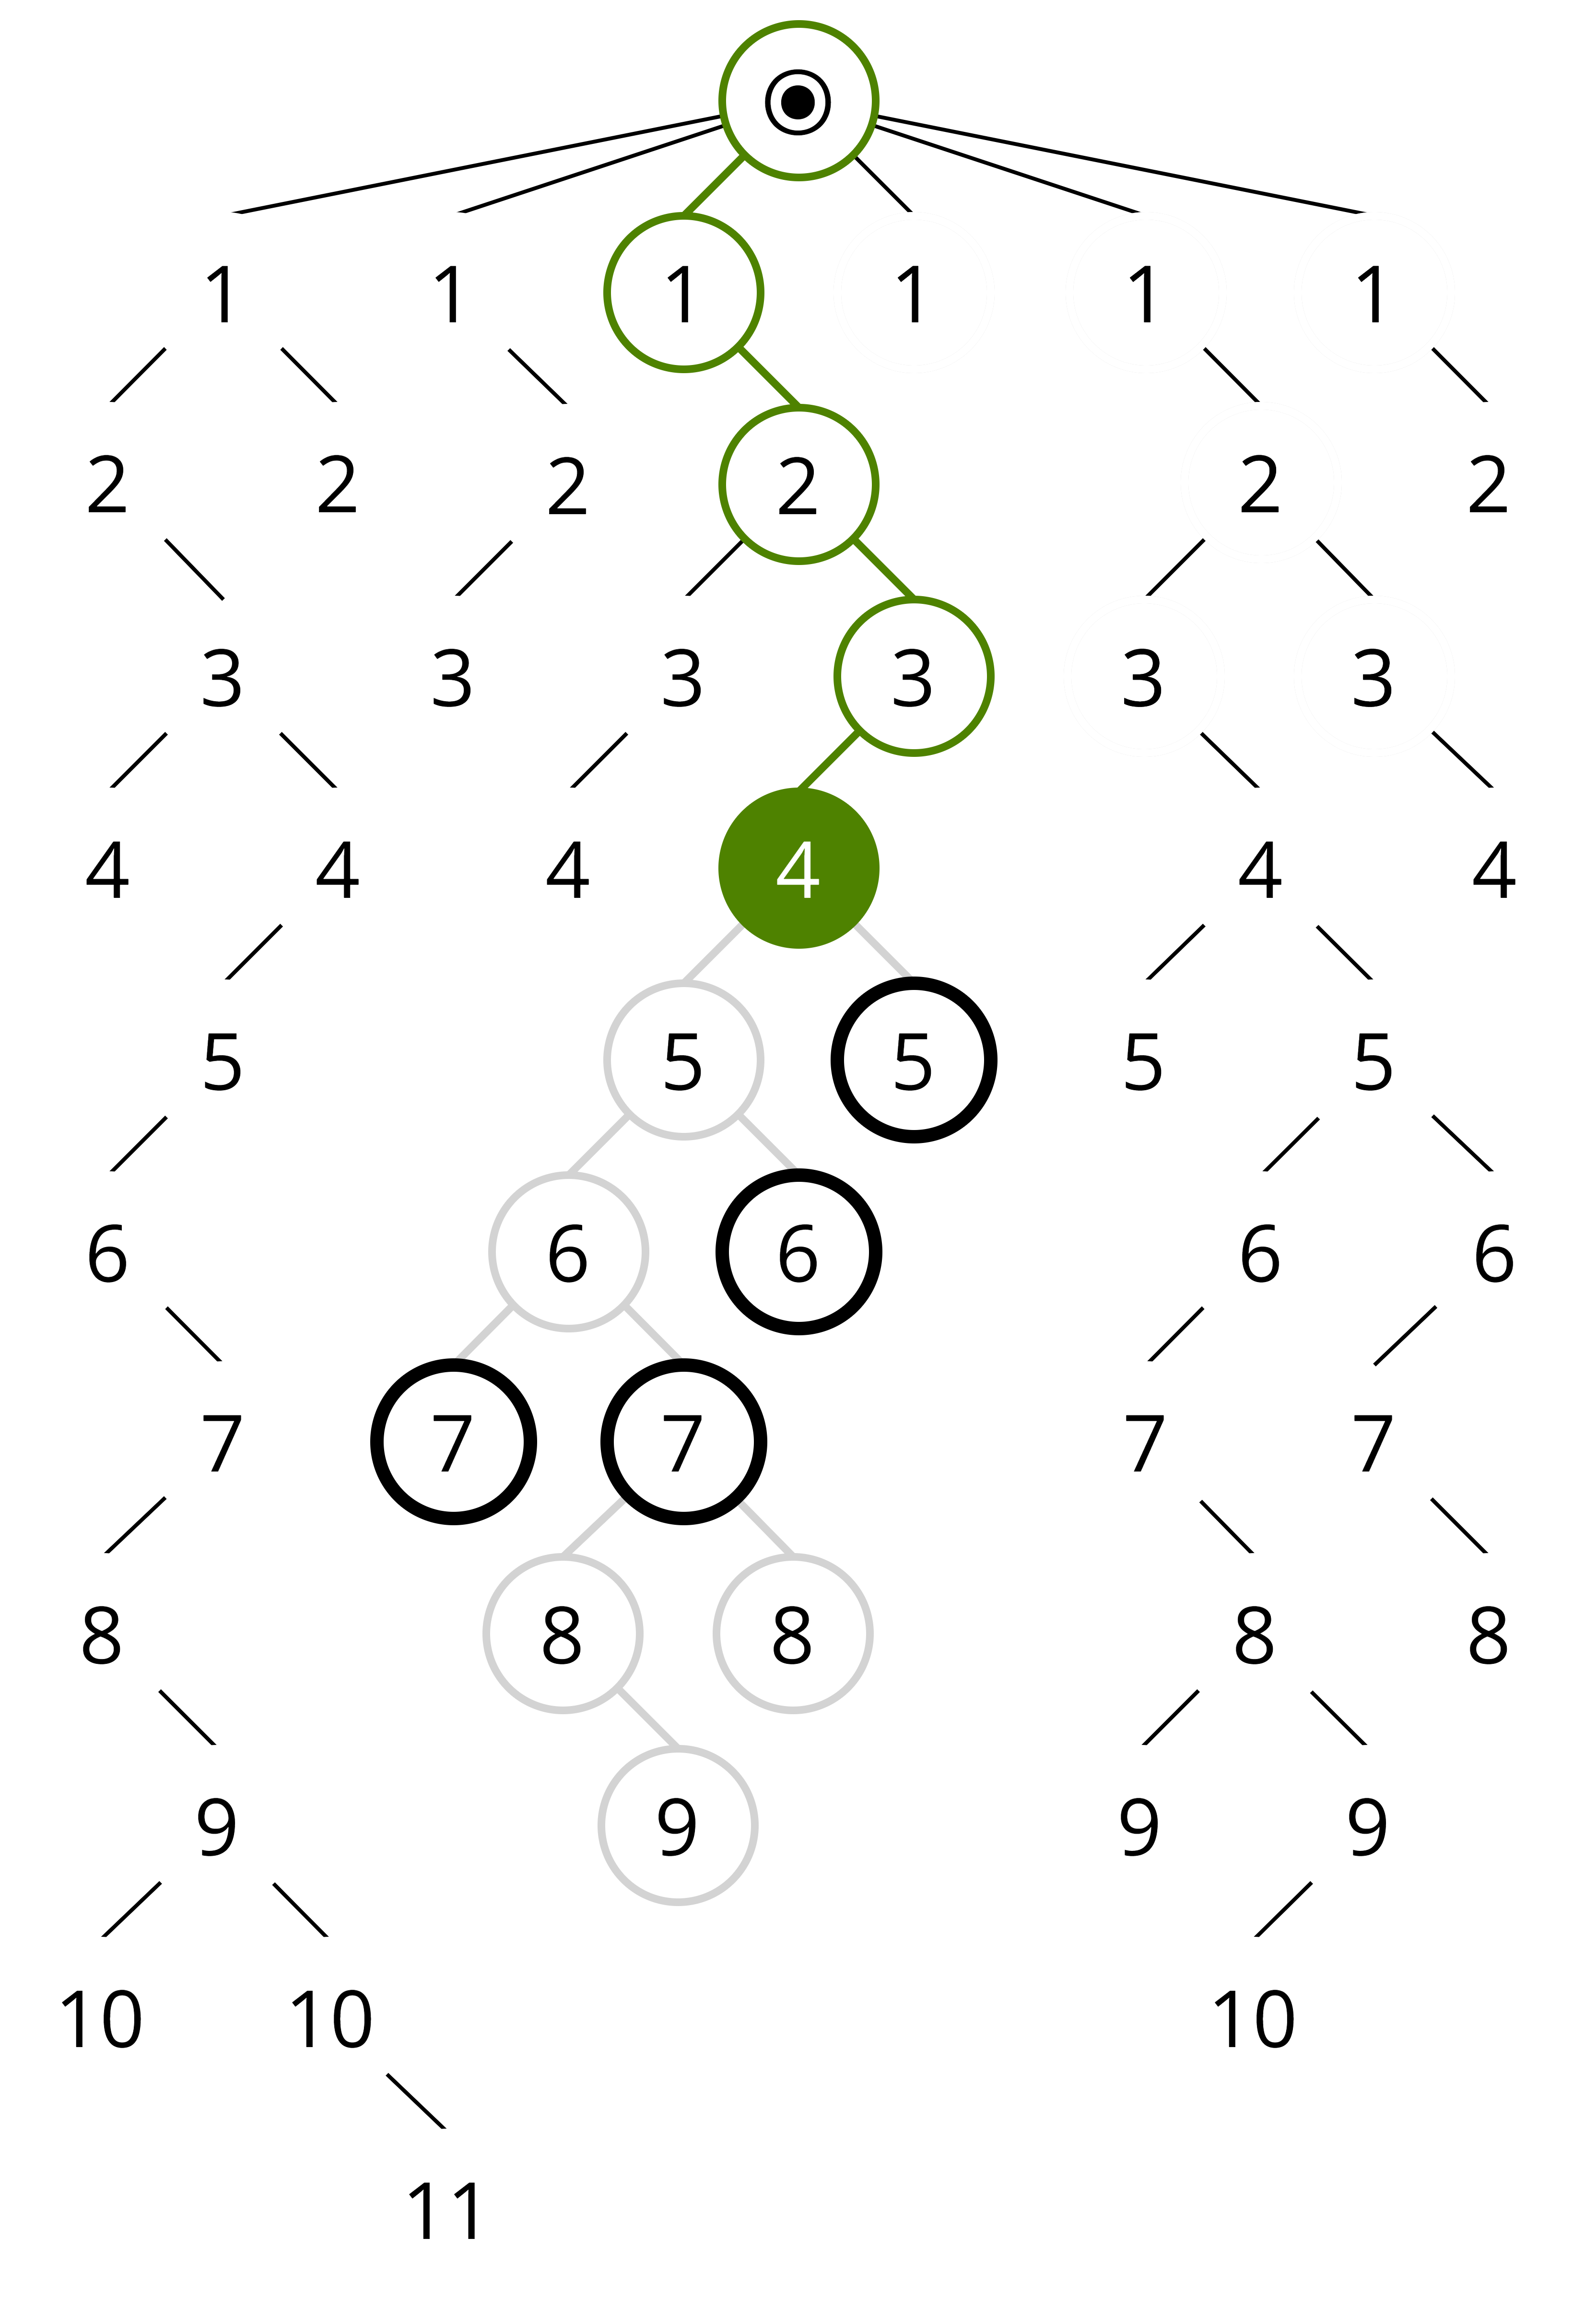
Every impact landscape has an interactable navigation menu called the “roadmap” (5). This roadmap visualizes wherein the hierarchy of the contribution tree you are located by representing the focal process with a green-filled dot (7). The green-bordered dots to the left of the focal dot represent the hierarchy levels that have already been traversed and the processes corresponding to these dots are displayed above the title (1). The leftmost dot with the black circle inside (6) always represents the root of the contribution tree. The grey-bordered dots to the right of the focal dot represent what levels can still be traversed from the perspective of the focal process.
To illustrate the logic behind the roadmap, the same colored dots have been laid out in a normal tree structure in the figure on the right.
There are two ways with which you can navigate the landscape(s) and explore the hidden layers.
Off-landscape / roadmap interaction (left figure)
On the one hand, you can use the roadmap to guide your exploration. By clicking on the right of the green filled focal dot, you can control the maximum level of detail that is revealed on the impact landscape (i.e. how many hierarchy levels down are shown). This is indicated by the black-bordered dot. By clicking on the left of the focal dot, you can return to one of the upper hierarchy levels, which will move the focal dot to the left.
On-landscape / field interaction (right figure)
On the other hand, you can use the fields to traverse the contribution tree and to get details on demand. By clicking on the fields, you can move down the hierarchy, which will move the focal dot to the right. In addition, you can hover over any field at which point a window will pop up containing additional information on the associated process.
You now know the most important aspects of the impact landscapes. Feel free to play around with them and adjust their settings to your preference. Enjoy!